Table of Content

A project management dashboard is one screen that shows whether a project is on track against its plan: status, schedule, budget, workload and risk. The usual mistake is to put everything on it. What belongs on the screen depends on who is looking and what they are able to change, so start there.
Which project dashboard do you need?
| Your situation | Build this view | Start with these measures |
|---|---|---|
| One project with a fixed plan and budget | Project status dashboard | Status, schedule performance index, cost performance index, milestones due, open blockers |
| A scrum or kanban team | Delivery dashboard | Sprint burndown, velocity, cycle time, throughput, escaped defects |
| A services firm juggling client work | Resource and capacity dashboard | Utilization, forecast demand against capacity by role, overallocated people |
| A PMO or leadership team | Portfolio dashboard | Projects by status, forecast spend against budget, capacity committed, projects red for a full cycle |
| Any project with a risk register | Risk and issue panel on the status view | Risk exposure, high risks without an owner, issues by age |
Most teams need two of these, not five. The portfolio view is usually one panel in an executive dashboard, so build the project-level views first and roll them up.
How do you define red, amber and green in numbers?
Status by opinion is the first thing to remove. Agree thresholds in advance and apply them to every project the same way. The values below are an example, not a standard, so adjust them to your delivery history.
| Status | Schedule performance index (SPI) | Cost performance index (CPI) | What it triggers |
|---|---|---|---|
| Green | 0.95 or higher | 0.95 or higher | Normal reporting |
| Amber | 0.85 to 0.95 | 0.85 to 0.95 | Recovery plan due within a week |
| Red | Below 0.85 | Below 0.85 | Sponsor review and a decision on scope, date or budget |
How do you read earned value on a real project?
Earned value turns progress into money so cost and schedule can be judged on the same scale. Take a project with a budget at completion of $200,000. It is 40% complete, the plan said it should be about 45% complete by now, and $95,000 has been spent. These are illustrative numbers, and the arithmetic is below.
| Measure | Formula | Result |
|---|---|---|
| Planned value (PV) | 45% x $200,000 | $90,000 |
| Earned value (EV) | 40% x $200,000 | $80,000 |
| Actual cost (AC) | From the finance system | $95,000 |
| Schedule performance index (SPI) | EV / PV = 80,000 / 90,000 | 0.89 (amber) |
| Cost performance index (CPI) | EV / AC = 80,000 / 95,000 | 0.84 (red) |
| Estimate at completion (EAC) | BAC / CPI = 200,000 / 0.842 | $237,500 |
| Forecast overrun | EAC – BAC | $37,500 |
The project looks modestly late, but the cost figure is the real warning: at the current rate it finishes about $37,500 over budget. That is the kind of signal a percent-complete bar on its own never gives. EAC = BAC / CPI assumes the current cost performance continues, so recalculate it each reporting period. Pair this view with the financial dashboard when the sponsor wants the company-level picture.
Which leading indicators warn you before a milestone slips?
Most project management dashboard measures are lagging: by the time a milestone is missed or cost has overrun, the damage is done. Leading indicators move first, and a good project dashboard puts them next to the lagging numbers.
| Leading indicator (moves first) | What it warns about | Lagging measure (confirms later) |
|---|---|---|
| Overdue tasks and their age | Schedule slip before the milestone date | Milestone slippage (forecast date minus baseline date) |
| Open blockers and days blocked | Work stopped by a dependency | Schedule performance index |
| Utilization above target for several weeks | Burnout and quality problems | Defects and rework |
| Change requests pending | Scope growth | Cost variance and budget overrun |
| High risks with no owner | Surprises that are already known | Issues raised after the fact |
Milestone slippage is the forecast or actual date minus the baseline date, so a milestone planned for March 1 and now forecast for March 15 has slipped 14 days. Show the critical path separately, because a late task off the critical path matters far less than one on it.
What does the dashboard look like?
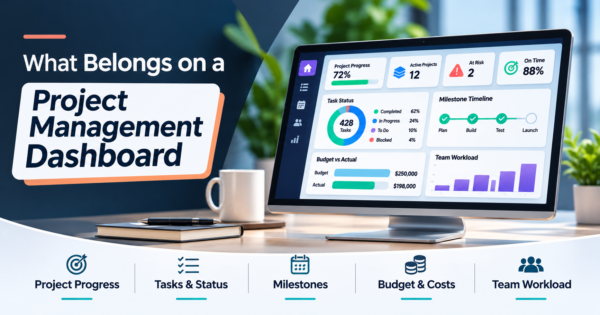
A project dashboard usually puts the health tiles on top, the progress trend in the middle and the blockers on the side. This sketch uses sample values.
Layout sketch with sample values, not real project data. The trend shows remaining work by week. Status comes from the index thresholds, not from opinion.
What belongs on a delivery view for agile teams?
Agile teams are measured by flow, not by earned value. Show the sprint burndown (remaining work against an ideal line), velocity (completed work per sprint, averaged over recent sprints), cycle time (work started to done), throughput (items finished per week) and escaped defects. Atlassian documents the velocity chart as comparing committed and completed work across sprints and the burndown chart as tracking remaining work within one sprint. Velocity describes one team’s rhythm and should never be used to rank teams against each other.
How do you see capacity before it becomes a problem?
Utilization is hours logged on project work divided by available hours. The more useful view looks forward: forecast demand against capacity by role for the next eight weeks, with overallocated people flagged. Below is a real example from our own work, the resource view of the CMES operations portal, built from field time data.

Which risk and issue numbers are worth showing?
Risk exposure is probability multiplied by impact for each open risk. Show the top few, flag any high risk with no mitigation owner, and show open issues by age so nothing sits unnoticed. Add change requests pending and contingency remaining. A risk panel with no owners is decoration.
What do good project dashboard examples have in common?
The strongest project dashboard examples differ in content but share a pattern: a handful of tiles, one trend and a list of what needs action. What changes is which tile leads.
| Team type | Tile that leads | Why |
|---|---|---|
| Software product team | Sprint burndown and escaped defects | Flow and quality matter more than budget |
| IT migration or implementation | Schedule performance index and blockers | Dependencies on vendors and other teams decide the date |
| Agency or consulting team | Utilization and budget burned against work completed | Margin depends on hours spent versus hours sold |
| Construction or field projects | Cost per labor hour and cost performance index | Labor and equipment cost drive overruns |
| PMO overseeing many projects | Count of projects red for a full cycle | Leadership attention is the scarce resource |
Where do AI agents help?
- Status report drafts. The agent assembles what changed since last week from task, time and budget data. The project manager edits and sends.
- Slip warnings. It flags tasks likely to run late from age, dependencies and the owner’s workload, with its reasoning shown.
- Meeting notes to tasks. It proposes tasks with owners and dates for a person to confirm.
Keep agents read-only until their suggestions prove right. Our guides to AI workflow automation tools and AI agents in ERP show how that looks in practice.
Which tool should you build it in?
Use your task tool’s own dashboards when plan, tasks and time live in one place. Use Power BI (Pro is $14 per user per month paid yearly, Desktop is a free download, read October 28, 2026) when you need to combine task, time and finance data, and Excel for a single project with a weekly review. Data Studio (formerly Looker Studio) has a no-cost version for simple shared views. For layouts, see our Power BI dashboard examples, Excel dashboard examples and operations dashboard examples.
Frequently Asked Questions
What is a project management dashboard?
A project management dashboard is one screen that shows a project’s health: status, schedule, budget, workload, risks and issues, each compared with a plan. It helps a project manager and sponsor see problems early instead of reading out numbers in a status meeting.
What should be on a project dashboard?
Pick five to eight measures per view. Common ones are overall status, percent complete, milestone dates, budget used versus work completed, cost and schedule performance indexes, overdue tasks, utilization, open risks and open blockers.
What is earned value in project management?
Earned value is the budgeted value of the work actually completed. Compare it with actual cost to get the cost performance index (EV / AC) and with planned value to get the schedule performance index (EV / PV). A value below 1.0 means over cost or behind schedule.
How do you calculate estimate at completion?
A common formula is budget at completion divided by the cost performance index. It assumes current cost performance continues. If you expect the remaining work to cost what was planned, use actual cost plus budget at completion minus earned value instead.
How do you define red, amber and green status?
Use numbers instead of judgment. For example, green when the schedule and cost performance indexes are at least 0.95, amber between 0.85 and 0.95, and red below 0.85. Write the thresholds down and apply them to every project.
What is a burndown chart?
A burndown chart shows remaining work in a sprint against an ideal line. If the actual line stays above the ideal line, the sprint is at risk of not finishing.
What is velocity?
Velocity is the amount of work a team completes per sprint, usually averaged over recent sprints. Teams use it to plan how much to commit to next. It describes one team’s own rhythm and should not be used to compare teams.
Can I build a project dashboard in Excel?
Yes, for one project with a weekly review. It gets fragile when task, time and finance data come from different tools or when many people need their own filtered view. At that point a BI tool such as Power BI, or a custom build, is safer.
How can AI improve a project dashboard?
AI agents can draft the weekly status report, flag tasks likely to slip, turn meeting notes into tasks and answer questions about the portfolio in plain English. Keep them read-only at first and have a project manager approve anything that goes to stakeholders.
Check these before you share it
- Every measure has a plan to compare against.
- Status colors come from written thresholds.
- Each red item has a named owner and a date.
- Project IDs match across the task, time and finance tools.
- You can drill from any tile to the underlying tasks.
If you want project dashboards connected to your tools with alerts and agents behind them, see our business intelligence dashboard services and AI automation.