Table of Content

What is a KPI dashboard?
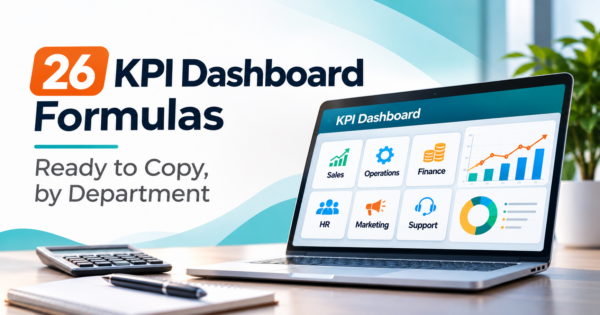
A KPI dashboard is one screen that tracks a small set of key performance indicators against targets, so a team can see what is on track and what needs action. Each KPI has a written definition, a target, an owner and a refresh schedule. That is what separates it from a general metrics dashboard.
TL;DR
- A KPI is a metric with a target, an owner and a decision attached. If nobody can say what they would do when it turns red, it is a metric, not a KPI.
- Build one dashboard per audience, with a handful of KPIs each. A dashboard that tries to serve everyone serves no one.
- Every KPI needs a formula written down once. Below are 26 KPIs across seven departments, each with its formula and the direction that counts as good.
- Status colors should come from a rule, not a feeling. Our worked scorecard uses 100% of target for green and 90% for amber, and flips the rule for KPIs where lower is better.
- Most dashboards fail on definitions and data feeds, not on charts. Reconcile every number to its source system before you design anything.
- CommercePundit builds KPI dashboards in Power BI, Tableau and Looker Studio and connects the sources behind them. See the last section.
What is the difference between a KPI dashboard and a metrics dashboard?
A metrics dashboard shows what happened. A KPI dashboard shows whether what happened is good enough, and who has to act if it is not.
| Metrics dashboard | KPI dashboard | |
|---|---|---|
| Target | Usually none | Every KPI has one |
| Status | The reader judges | Rule-based color: green, amber, red |
| Owner | Nobody in particular | One named person per KPI |
| Count | As many as the data allows | A handful per audience |
| Question it answers | What is happening? | Are we on plan, and what do we do about it? |
Run each candidate through five questions: what decision does it support, who owns it, what is the target, where does the data come from, and how often does it change? A metric that fails two or more belongs on a detail page, not the main screen.
What does a KPI dashboard look like?
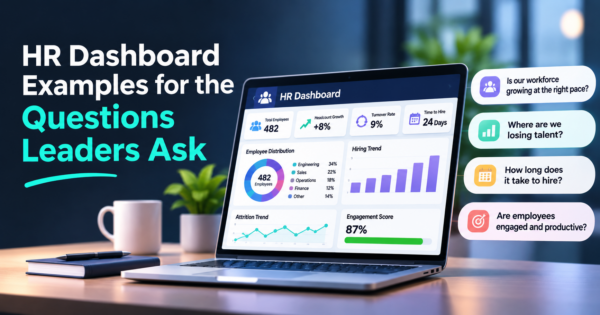
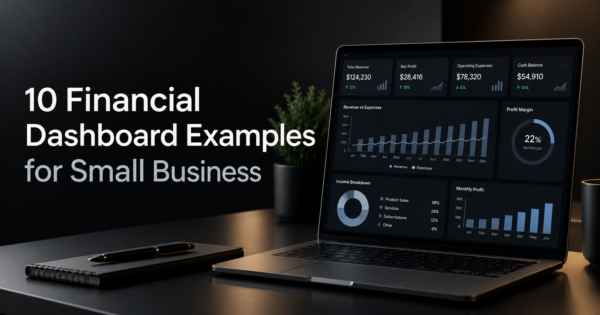
The layout most KPI dashboards share: headline KPIs on top, one trend below, and a short list of exceptions with owners on the right. Numbers are illustrative.
Three parts do the work. The headline tiles show each KPI against its target. The trend shows whether it is improving. The exceptions list names the KPIs that need action and who owns them. Everything else is detail behind a click.
What are the best KPI dashboard examples by department?
Use these as a starting library and cut it down to what your audience can act on. The formulas are standard; write yours down before you build.
Revenue and customers
| Department | KPI | Formula | Good is |
|---|---|---|---|
| Sales | Win rate | Deals won / (deals won + deals lost) | Higher |
| Sales | Pipeline coverage | Open pipeline value / remaining quota | Higher |
| Sales | Average sales cycle | Average days from created to closed won | Lower |
| Sales | Forecast accuracy | 1 – (absolute forecast error / actual) | Higher |
| Marketing | Cost per lead | Marketing spend / leads generated | Lower |
| Marketing | MQL to SQL rate | Sales qualified leads / marketing qualified leads | Higher |
| Marketing | Customer acquisition cost | Sales and marketing spend / new customers | Lower |
| Customer success and support | Churn rate | Customers lost in period / customers at start | Lower |
| Customer success and support | Net revenue retention | (Starting recurring revenue + expansion – contraction – churn) / starting recurring revenue | Higher |
| Customer success and support | First response time | Average time from ticket created to first reply | Lower |
| Customer success and support | CSAT | Satisfied responses / total responses | Higher |
Money and delivery
| Department | KPI | Formula | Good is |
|---|---|---|---|
| Finance | Gross margin | (Revenue – cost of goods sold) / revenue | Higher |
| Finance | Days sales outstanding | Accounts receivable / revenue x days in period | Lower |
| Finance | Budget variance | (Actual – budget) / budget | Closer to zero |
| Finance | Cash runway | Cash on hand / monthly net burn | Higher |
| Operations | On-time delivery rate | Orders delivered on time / orders delivered | Higher |
| Operations | Capacity utilization | Hours used / hours available | Target range |
| Operations | Defect rate | Defective units / units produced | Lower |
People and technology
| Department | KPI | Formula | Good is |
|---|---|---|---|
| HR | Voluntary attrition rate | Voluntary leavers / average headcount | Lower |
| HR | Time to hire | Offer accepted date – requisition opened date | Lower |
| HR | Offer acceptance rate | Offers accepted / offers made | Higher |
| HR | eNPS | Percent promoters – percent detractors | Higher |
| IT and engineering | Uptime | (Total time – downtime) / total time | Higher |
| IT and engineering | Mean time to restore | Total restore time / number of incidents | Lower |
| IT and engineering | Deployment frequency | Production deployments per period | Higher |
| IT and engineering | Change failure rate | Failed changes / total changes | Lower |
Capacity utilization is marked “target range” because 100% is rarely the goal. For department-specific layouts, see our sales, marketing, HR, financial and operations dashboard guides, and the executive dashboard examples for the top-level view.
What does a scorecard look like with real numbers?
The figures below are our own illustration. Variance is (actual – target) / target. Status follows one rule: for KPIs where higher is better, green is at or above target and amber is within 90% of target. For KPIs where lower is better, the ratio is flipped (target / actual) so that red always means act.
| KPI | Actual | Target | Variance | Good is | Status |
|---|---|---|---|---|---|
| Revenue ($) | $1,240,000 | $1,300,000 | -4.6% | Higher | Amber |
| Gross margin (%) | 41.0% | 40.0% | +2.5% | Higher | Green |
| Win rate (%) | 22.0% | 28.0% | -21.4% | Higher | Red |
| Days sales outstanding | 47 | 40 | +17.5% | Lower | Red |
| Monthly churn (%) | 1.8% | 2.0% | -10.0% | Lower | Green |
| First response time (hours) | 4.2 | 4.0 | +5.0% | Lower | Amber |
| Annualized voluntary attrition (%) | 9.0% | 10.0% | -10.0% | Lower | Green |
Two reds and two ambers out of seven. The win rate and the days sales outstanding are the ones to discuss: win rate is 21% under target, and DSO is 17.5% over. Revenue is 4.6% under target, which is amber, so the right question is whether the win rate explains it. A good dashboard puts that question in front of the sales lead before the review meeting starts.
How many KPIs should a dashboard have?
Enough that each one can be explained in a sentence, and few enough that the screen can be read in under a minute. As a starting rule we suggest five to nine per audience. An executive screen might show seven company KPIs, and each department lead gets their own screen of five to nine for their function. If a KPI never changes a decision for three review cycles in a row, remove it.
Where does KPI data come from, and how often should it refresh?
| Source system | Typical KPIs | Refresh |
|---|---|---|
| CRM | Win rate, pipeline coverage, sales cycle, forecast accuracy | Daily |
| Marketing and web analytics | Cost per lead, MQL to SQL rate, acquisition cost | Daily |
| Accounting or ERP | Gross margin, DSO, budget variance, cash runway | Daily to monthly |
| Billing or subscription system | Churn, net revenue retention | Daily |
| Helpdesk | First response time, CSAT | Hourly to daily |
| HRIS and applicant tracking | Attrition, time to hire, offer acceptance | Weekly |
| Monitoring and deployment tools | Uptime, mean time to restore, deployment frequency | Real time to daily |
Refresh should match the decision cycle. A KPI reviewed monthly does not need a real-time feed, and a real-time feed on a monthly KPI invites people to react to noise.
How do you build a KPI dashboard?
The order matters. Teams that start at step 4 end up redrawing the dashboard every time someone disputes a number.
Write the definitions in a one-page KPI dictionary that anyone can read. Reconcile each KPI to its source before the first review, then run the dashboard beside the old report for a cycle. Power BI, Tableau, Looker Studio and Excel can all do the job. Our Power BI dashboard examples show layouts you can adapt, and our business intelligence dashboard services team builds and connects them.
Where does AI help on a KPI dashboard?
AI is useful for the narrative around the numbers: a plain-English summary of what changed since the last review, a flag when a KPI moves outside its normal range, and a way to ask a question such as which regions missed target. Keep the calculations in the data layer, show the figures beside any generated text, and have a person review anything sent outside the team. Our AI integration services connect those assistants to your own data.
What mistakes make KPI dashboards fail?
| Mistake | What happens | Fix |
|---|---|---|
| No written definitions | Two people calculate two different win rates | Keep a one-page KPI dictionary |
| No target or owner | The number is watched but nobody acts | Assign both before a KPI goes live |
| Too many KPIs | Everything is on screen, nothing is read | Five to nine per audience |
| Color by feel | Status argues with itself every meeting | Use a rule: share of target |
| Higher is better assumed | A rising churn rate turns green | Mark direction for every KPI |
| Unreconciled data | Nobody trusts the screen | Tie each number to its source first |
Frequently Asked Questions
What is a KPI dashboard?
A KPI dashboard is a single screen that tracks key performance indicators against targets, with a defined owner and refresh schedule for each. It shows whether results are on plan and which items need action.
What is the difference between a KPI and a metric?
A metric is any measurement. A KPI is a metric tied to a goal, with a target, an owner and a decision attached. Website visits is a metric; qualified leads against a monthly target, owned by a named person, is a KPI.
How many KPIs should be on a dashboard?
Aim for five to nine per audience as a starting rule. Fewer is better when each KPI drives a decision, and detail belongs on drill-down pages.
What are examples of KPIs by department?
Sales uses win rate and pipeline coverage, marketing uses cost per lead and acquisition cost, support uses first response time and CSAT, finance uses gross margin and days sales outstanding, operations uses on-time delivery, HR uses attrition and time to hire, and IT uses uptime and mean time to restore.
What is the difference between a KPI dashboard and a scorecard?
The terms overlap. A scorecard usually compares results with targets at a set interval, often monthly or quarterly. A dashboard is typically more visual and refreshed more often. Many teams use one screen for both.
How do you set KPI targets?
Start from last year’s actuals and the plan, then adjust for known changes. Agree each target with its owner, write down the threshold for amber and red, and review targets once a quarter or when the plan changes.
Can I build a KPI dashboard in Excel?
Yes, for a small number of KPIs and one data source. The risks are manual updates, version drift and formulas that differ by person, which is why growing teams move to a BI tool with scheduled refresh.
How often should a KPI dashboard be updated?
Match the decision cycle. Daily for operational KPIs such as pipeline and tickets, weekly for pace KPIs, and monthly for finance and people KPIs. Faster refresh than the review cycle adds noise, not insight.
Can AI build a KPI dashboard for me?
AI can draft layouts, suggest KPIs and write formulas, which speeds up the first version. You still need to define each KPI, connect and reconcile the data, and check every number before anyone relies on it.
Bottom Line
A KPI dashboard works when every number has a definition, a target, an owner and a rule for its color. Pick a handful per audience, build from your source systems, reconcile before you design, and review on a fixed cadence. If you want help connecting your CRM, ERP and support data into dashboards your teams will actually use, talk to us about AI automation.