Table of Content

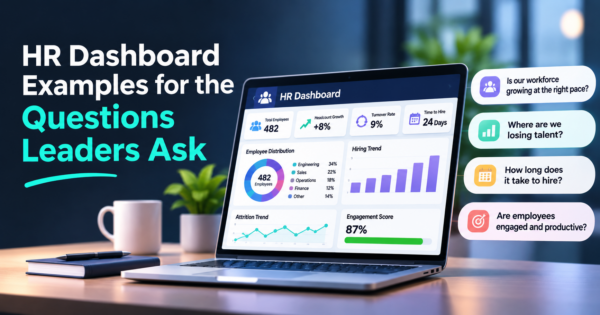
It is Monday, and the CEO asks why three engineers left last quarter and whether the open roles will be filled before the launch. If answering takes a day of exports and a spreadsheet, you need an HR dashboard. An HR dashboard, also called a human resources dashboard, is one view of workforce data such as headcount, hiring, turnover, engagement and absence, shown against targets and refreshed from your HR systems.
Short version: do not build one big HR dashboard. Build one small view for each question leaders actually ask, give every number a formula and a target, and decide who may see what before anyone logs in.
What does an HR dashboard look like?
Most HR dashboards share one layout: number tiles across the top, a single trend chart for the metric you are trying to move and a short list of exceptions. This sketch uses sample values to show the pattern.
Layout sketch with sample values, not real company data. The trend shows monthly separations. Each tile has a target, and the right column is the to-do list.
Seven questions HR gets asked, and the view that answers each
These HR dashboard examples are organized by the question being asked, because that is how requests arrive. Treat every target as a starting point and set it from your own history.
Are we hiring fast enough?
The recruiting view tracks time to fill (days from approved requisition to accepted offer), time to hire (days from application to accepted offer), offer acceptance rate (offers accepted divided by offers made), cost per hire (total hiring costs divided by hires) and conversion between stages. The two time measures answer different questions: time to fill shows how long a seat stayed empty, while time to hire shows how fast your process moves one candidate. Data comes from the applicant tracking system. Our guide to AI recruiting workflows covers what can be automated at each stage.
Watch for: teams that start the clock at job posting while others start at requisition approval, which makes every comparison meaningless.
Where are we losing people?
Turnover rate is separations in a period divided by average headcount in the same period, multiplied by 100. Pair it with voluntary versus involuntary exits, first-year turnover, retention rate and tenure at exit. Data comes from HRIS termination records and exit surveys. Break it down by team and manager, because a healthy company average can hide one team that is bleeding.
Watch for: mixing monthly and annual figures in one chart. State the period in every chart title.
How do people feel?
Employee net promoter score is the percent of promoters (scores of 9 or 10) minus the percent of detractors (0 to 6) on a 0 to 10 recommendation question. Show it with the survey response rate and the change since the last survey. The full set of measures is in our guide to employee engagement metrics.
Watch for: a response rate too low to trust, and small teams where a few answers swing the score.
Are new hires landing?
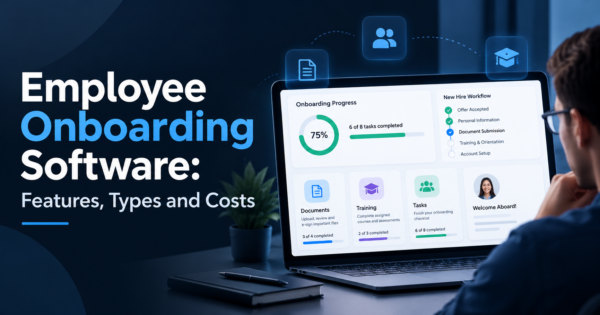
Track onboarding task completion, days until equipment and system access are ready, time to a full workload, 90-day retention and new hire feedback. A new hire with open tasks on day three is the earliest warning you will get. The tools behind this view are compared in our guide to employee onboarding software.
Watch for: measuring completion of HR tasks only. Include the manager tasks, which are the ones that slip.
Who is out, and are we covered?
Absence rate is unplanned absence days divided by scheduled working days, multiplied by 100. Add leave balances and the accrued liability they represent, requests pending approval, overtime as a share of regular hours and coverage by shift. Data comes from the time-off and timekeeping systems.
Watch for: overtime rising for several weeks in the same team. That pattern usually shows up before the resignation does.
Is pay fair?
Compa-ratio is an employee’s pay divided by the market midpoint for the role. Show position in pay range, pay by level and group, merit increase distribution and labor cost as a share of revenue. Data comes from payroll and a market pay source. Restrict this view to a very small group.
Watch for: comparing people in different roles or locations without adjusting for the role midpoint.
Are we compliant?
Show required training completion (completed divided by assigned), certifications expiring in the next 30 days, policy acknowledgment rate and missing required documents. Data comes from the learning system and HRIS. Rules differ by state and industry, so confirm your requirements with counsel.
Watch for: a certification that lapses without anyone being notified. Build the alert before the chart.
Which definitions should you settle before you build?
Every HR metrics dashboard fails the same way: two people calculate the same number differently and the meeting becomes an argument about the data. HR analytics is mostly the unglamorous work of agreeing these definitions once.
| Decision | Options people choose | What to write down |
|---|---|---|
| Who counts in headcount | Employees only, or employees plus contractors and interns | The rule, and show contractors as a separate tile |
| When a role is open | From requisition approval, from job posting, or from the day the seat empties | One start date for time to fill |
| What counts as a separation | Resignations only, or also layoffs, retirements and end of contract | Voluntary and involuntary shown separately |
| What period a rate covers | Month, quarter, trailing 12 months | The period in every chart title |
| Which employee ID is the key | HRIS ID, payroll ID or email | One ID mapped across every source system |
Who should see what?
HR data is sensitive, so access is part of the design, not an afterthought. A role matrix written before launch prevents most of the problems HR dashboards cause.
| Viewer | Can see | Should not see |
|---|---|---|
| Manager | Their own team: headcount, open roles, absence, engagement score if the team is large enough | Individual pay, performance ratings, health-related absence reasons |
| HR business partner | Everything for the groups they support | Records outside their remit |
| HR leadership | Company-wide trends, compensation view, compliance view | Individual records unless a case requires it |
| Executives | Summary tiles and trends | Anything that identifies a person |
Set a minimum group size so a small team cannot be identified from an average, and log who opens which view. Rules vary by state and country, so confirm requirements with counsel before you share people data widely.
How do you judge turnover against an outside number?
The BLS Job Openings and Labor Turnover Survey publishes national monthly rates. For August 2026, the release dated September 29, 2026 shows a total separations rate of 3.2%, a quits rate of 1.9%, a hires rate of 3.3% and a layoffs and discharges rate of 1.0% (Bureau of Labor Statistics JOLTS). These are monthly, all-industry figures, so compare them with your own monthly turnover and use them only as a sanity check. Your industry and role mix matter more than the national average.
Where does AI help an HR dashboard, and where should it stay out?
An AI agent connected to the same data can watch thresholds daily, explain a change in plain language (“time to fill rose because offers in one region take nine days to approve”), answer a manager question about their own team and draft the weekly digest. Keep it read-only and let a person review anything that is sent.
Be careful with predictions about individuals, such as who might resign. They can be wrong, can repeat bias from past decisions and may be restricted by local law. Use team-level patterns to start a conversation, and keep decisions about people with people. Our guide to AI in HR covers where automation helps and where it does not.
Which tool can build it?
Your HRIS reports are enough for basic headcount and turnover. For several sources in one view, Power BI Pro is priced at $14 per user per month paid yearly and Power BI Desktop is a free download (read October 28, 2026), Tableau is priced by role and plan, Data Studio (formerly Looker Studio) has a no-cost version and a Pro tier according to Google documentation, and Excel works for a small team with one export. Layouts for the first two are in our Power BI dashboard examples and Excel dashboard examples. These views also feed the HR panel of an executive dashboard.
Frequently Asked Questions
What is an HR dashboard?
An HR dashboard is a single view of workforce data, such as headcount, hiring, turnover, engagement and absence, shown against targets and updated from your HR systems. It helps HR and managers see problems early instead of waiting for a report.
What metrics should an HR dashboard include?
Pick five to eight that answer one question. Common ones are headcount, vacancy rate, time to fill, offer acceptance rate, turnover rate, first-year turnover, employee net promoter score, absence rate and training completion rate. Each needs a formula, a target and an owner.
How do you calculate employee turnover rate?
Divide the number of separations in a period by the average headcount in the same period and multiply by 100. Average headcount is the starting headcount plus the ending headcount, divided by two. State whether the period is a month or a year.
What is the difference between time to fill and time to hire?
Time to fill counts days from an approved requisition to an accepted offer, so it shows how long a role was open. Time to hire counts days from a candidate’s application to their accepted offer, so it shows how fast your process moves a candidate.
What is eNPS?
Employee net promoter score asks how likely someone is to recommend the company as a place to work, on a 0 to 10 scale. Promoters score 9 or 10 and detractors score 0 to 6. The score is the percent of promoters minus the percent of detractors.
How often should an HR dashboard refresh?
Match the decision. Open roles and approvals benefit from daily updates, absence and overtime from daily or weekly, and turnover and engagement from monthly or after each survey.
How do you keep an HR dashboard private and compliant?
Use role-based access, hide groups too small to be anonymous, keep salary and performance data in a restricted view and log who opens what. Rules vary by state and country, so confirm requirements with counsel.
Can AI improve an HR dashboard?
Yes, in a supporting role. AI agents can watch for changes, explain the likely cause, answer manager questions and draft the weekly digest. Keep them read-only at first, and keep any decision about a person with a human reviewer.
Where to start on Monday
Pick the one question your leadership asks most often, write the formula and target for its three numbers, and build that single view with the access rules above. Add the next question only when people open the first one. If you want it connected to your HR, payroll and finance systems, see our business intelligence dashboard services, predictive analytics and AI automation.