Table of Content

What does a good Tableau dashboard example include?
A good Tableau dashboard example shows one business question, a handful of charts that answer it, and filters or actions that let the reader drill down. Behind each chart sit a few specific fields and, usually, one or two calculated fields. Knowing those fields is what lets you rebuild an example on your own data.
TL;DR
- Most Tableau examples online show a finished picture. This guide shows the chart types, the fields and the calculated fields behind eight business dashboards, so you can build them.
- Every example starts from tidy data: one row per transaction or event, with a real date field, and the same key (customer, order, ticket) across tables.
- Three calculation patterns cover most of these dashboards: a ratio of two aggregates, a table calculation across time, and a fixed level of detail (LOD) expression for cohorts.
- The layout sketches here are our own illustrations, not screenshots of a Tableau workbook. For real workbooks, browse the Tableau gallery linked below.
- Performance and clarity come from the same habits: few sheets per dashboard, extracts for large data and one question per page.
- CommercePundit builds dashboards in Tableau, Power BI, Looker and Looker Studio. See the last section.
What do you need before you build a Tableau dashboard?
| Check | Why it matters |
|---|---|
| One row per transaction or event | Tableau aggregates the rows you give it; mixed grains double count |
| A real date field | Time charts, year-over-year and cohorts all depend on it |
| Consistent keys across tables | Customer, order and ticket IDs let you join and count distinct values |
| A target or budget table | Variance and attainment need a second source to compare with |
| Extract or live connection decided | Extracts are usually faster for large data; live suits data that must be current |
| Metric definitions written down | The same KPI should be calculated once, in one place |
Which Tableau dashboard examples are worth building?
The common structure of the examples below: KPI tiles on top, a trend or comparison in the middle, and exceptions or a detail table below.
1. Sales performance against quota
Answers: who is on track to hit quota and where is the pipeline thin? Our sales dashboard examples cover the metric definitions.
| Chart | Fields | Calculation or setup |
|---|---|---|
| Bullet chart by rep | Sales, Quota, Rep | Attainment: SUM([Sales]) / SUM([Quota]); quota as the reference line |
| Funnel by stage | Stage, Opportunity ID | Count distinct opportunities per stage with COUNTD([Opportunity ID]) |
| Win rate | Stage | Win rate: SUM(IIF([Stage]="Won",1,0)) / SUM(IIF([Stage]="Won" OR [Stage]="Lost",1,0)) |
| Rep detail table | Rep, Region, Sales, Attainment | Filter action from the bullet chart to the table |
2. Executive KPI overview
Answers: how is the company doing against last year and the plan? See also our executive dashboard examples.
| Chart | Fields | Calculation or setup |
|---|---|---|
| KPI tiles (big numbers) | Revenue, Margin, Pipeline | One sheet per KPI with the value as text; color by a status calculation |
| Sparkline per KPI | Order Date, Revenue | Continuous month on columns, no axes or gridlines |
| Year-over-year change | Revenue by month | Table calculation: (SUM([Sales]) - LOOKUP(SUM([Sales]), -12)) / ABS(LOOKUP(SUM([Sales]), -12)), computed along the month axis |
| Region comparison | Region, Revenue, Plan | Bar for actual with plan as a reference line |
3. Finance: budget versus actual
Answers: where are we over or under budget, and by how much? Our financial dashboard examples go deeper on the metrics.
| Chart | Fields | Calculation or setup |
|---|---|---|
| Variance bars by department | Department, Actual, Budget | Variance: SUM([Actual]) - SUM([Budget]); variance percent: (SUM([Actual]) - SUM([Budget])) / SUM([Budget]) |
| Running total vs budget | Month, Actual, Budget | Running total: RUNNING_SUM(SUM([Actual])) with budget as a second line |
| Account detail | Account, Actual, Budget | Hierarchy from department to account; sort by absolute variance |
| Over/under flag | Variance | Color calculation: IF [Variance] > 0 THEN "Over" ELSE "Under" END |
4. Marketing funnel and channel return
Answers: which channels turn spend into pipeline? Compare with our marketing dashboard examples.
| Chart | Fields | Calculation or setup |
|---|---|---|
| Funnel by stage | Visits, Leads, MQLs, SQLs | Stage conversion: SUM([SQLs]) / SUM([MQLs]), SUM([MQLs]) / SUM([Leads]) |
| Channel return | Channel, Spend, Revenue | Return on ad spend: SUM([Revenue]) / SUM([Spend]) |
| Cost per lead trend | Month, Spend, Leads | Ratio of aggregates: SUM([Spend]) / SUM([Leads]) |
| Channel selector | Channel | Parameter plus a calculated field so one chart can show any metric |
5. Customer retention cohorts
Answers: of the customers acquired in a month, how many are still buying later?
| Chart | Fields | Calculation or setup |
|---|---|---|
| First purchase date | Customer ID, Order Date | LOD: { FIXED [Customer ID] : MIN([Order Date]) } named First Order Date |
| Months since first order | First Order Date, Order Date | Calculated field: DATEDIFF('month', [First Order Date], [Order Date]) |
| Cohort heat map | Cohort month on rows, months since on columns | Retention: COUNTD([Customer ID]) / MIN({ FIXED [Cohort Month] : COUNTD([Customer ID]) }) |
| Cohort size | Cohort month | Count distinct customers per cohort |
6. Operations: on-time delivery
Answers: are we delivering when we promised, and where does it slip?
| Chart | Fields | Calculation or setup |
|---|---|---|
| On-time rate trend | Order ID, Delivered Date, Promised Date | On-time rate: SUM(IIF([Delivered Date] <= [Promised Date],1,0)) / COUNT([Order ID]) |
| Delay by site or carrier | Site, Carrier | Bar sorted by late share; highlight above target |
| Days late distribution | Delivered Date, Promised Date | Calculated field: DATEDIFF('day', [Promised Date], [Delivered Date]) as a histogram |
| Late orders list | Order ID, Customer, Days Late | Drill-through table filtered by selected bar |
7. HR: headcount and attrition
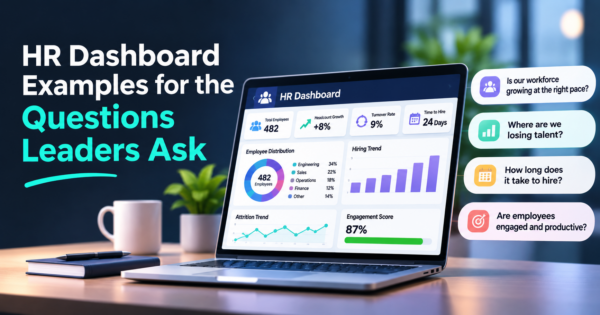
Answers: who is leaving, from where, and is it getting worse? Our HR dashboard examples list the questions leaders ask.
| Chart | Fields | Calculation or setup |
|---|---|---|
| Headcount trend | Month, Headcount | Line by month; split by department with a filter |
| Attrition rate | Leavers, Headcount | Rate for the period: SUM([Leavers]) / AVG([Headcount]); annualize in a separate field |
| Leavers by tenure band | Tenure, Leavers | Calculated tenure bands with a CASE statement |
| Department comparison | Department, Attrition rate | Bar with the company rate as a reference line |
8. Support: SLA and backlog
Answers: are tickets resolved inside the promise, and is the queue growing?
| Chart | Fields | Calculation or setup |
|---|---|---|
| SLA attainment | Ticket ID, Resolution Hours, SLA Hours | Rate: SUM(IIF([Resolution Hours] <= [SLA Hours],1,0)) / COUNT([Ticket ID]) |
| Backlog over time | Created Date, Closed Date | Open tickets per day with a table calculation over created minus closed |
| Response time | Created, First Reply | Average hours to first reply by queue |
| Queue view | Queue, Priority | Heat map of tickets by priority and age |
Which calculation patterns do these examples reuse?
| Pattern | Use it for | Example |
|---|---|---|
| Ratio of two aggregates | Rates and attainment | Win rate, on-time rate, return on ad spend |
| Table calculation across time | Year-over-year, running totals, moving averages | LOOKUP, RUNNING_SUM, WINDOW_AVG |
| Fixed level of detail (LOD) | Cohorts, first dates, per-customer values | FIXED on Customer ID or Cohort Month |
| Parameter plus CASE | One chart that switches metrics | Metric selector for channels or regions |
| Reference line | Targets, budgets and averages | Quota, budget, company rate |
How do you design the dashboard so people use it?
- One question per dashboard. If a page needs a paragraph to explain, split it.
- Put the most important view at the top left, where readers start.
- Use actions, not more filters. A filter action from an overview chart to a detail table keeps the page small.
- Keep sheets few. Each sheet is a query; fewer sheets and extracts for large data generally make dashboards faster.
- Test on the device people use. Build a phone or tablet layout if executives read it there.
- Color for meaning. Red and green only for status, and add a text or icon cue for color-blind readers.
Where can you see real Tableau dashboards?
Tableau’s own dashboard examples page and its public gallery show finished workbooks. On Tableau Public you can often download a workbook and open it in Tableau Desktop to see how it was built, which is the best way to study a layout. Anything published to Tableau Public is visible to everyone, so do not use it for company data.
Tableau or Power BI?
Choose based on your stack, your team’s skills and your budget, not on the chart gallery. Teams already standardized on Microsoft 365 often start with Power BI, and teams that need flexible visual exploration often lean toward Tableau. The examples above carry over to either tool, because the thinking is in the fields and calculations. See our Power BI dashboard examples for the same ideas in that tool, and our Excel dashboard examples if you are starting in a spreadsheet.
Where does AI help with Tableau dashboards?
AI is useful for first drafts: suggesting which fields answer a business question, writing a calculated field from a plain-language description, and summarizing what a chart shows. Check every generated calculation against a few rows you can verify by hand, because a plausible formula can aggregate at the wrong level. Our AI integration services team connects dashboards to the data and assistants behind them.
What mistakes make Tableau dashboards slow or misleading?
| Mistake | What happens | Fix |
|---|---|---|
| Too many sheets and filters | Slow load; cluttered page | One question per dashboard; use actions |
| Averaging averages | Wrong rates for groups of different size | Ratio of sums: SUM over SUM |
| Mixed grain in one source | Double counted measures | Keep one row per event; join carefully |
| Hard-coded targets | Targets go stale | Load targets from a table |
| No definitions | Two teams show different win rates | Document each KPI once |
| Public workbook with private data | Data exposure | Keep company data off Tableau Public |
Frequently Asked Questions
What is a good example of a Tableau dashboard?
A sales dashboard that shows attainment against quota by rep in a bullet chart, a funnel by stage, the win rate and a detail table, with a filter action linking the overview to the detail. Each chart uses a few fields and one or two calculated fields.
What are the types of Tableau dashboards?
Common business types are sales, executive overview, finance, marketing, customer retention, operations, HR and support. They can also be classed as operational, analytical, strategic or tactical, depending on the audience and refresh rate.
How do you make a dashboard in Tableau?
Connect to your data, check that each row is one event, build individual sheets, assemble them on a dashboard, add filter or highlight actions, set the layout and publish. Start with one question and a few charts.
What is a calculated field in Tableau?
It is a formula you write to create a new value from existing fields, such as a rate, a flag or a date difference. Examples in this guide include attainment, win rate and on-time delivery rate.
What is a LOD expression in Tableau?
A level of detail expression computes a value at a level you specify, independent of the chart. A fixed expression such as the first order date per customer is the basis of cohort analysis.
Is Tableau Public free?
Yes, Tableau Public is free to use, but everything you publish is visible to anyone. It is suited to learning and public data, not to confidential company information.
How do you make a Tableau dashboard faster?
Use extracts for large data, limit the number of sheets and filters on each dashboard, avoid unnecessary detail-level charts and simplify calculations. Test load time with realistic data volumes.
Should I use Tableau or Power BI?
It depends on your existing tools, team skills and budget. Both can build all the examples here, so choose the one your team can maintain and your data connects to best.
Can AI write Tableau calculations?
It can draft calculated fields and LOD expressions from a description, which saves time. Always test the result on a sample you can check by hand, because the aggregation level is easy to get wrong.
Bottom Line
A Tableau dashboard is a handful of charts, a few fields and a couple of calculations. Start from tidy data, pick one business question, reuse the calculation patterns above and design for the reader’s next action. If you want dashboards built on your own data, in Tableau, Power BI or another tool, see our business intelligence dashboard services and AI automation.