Table of Content

What is DAX in Power BI?
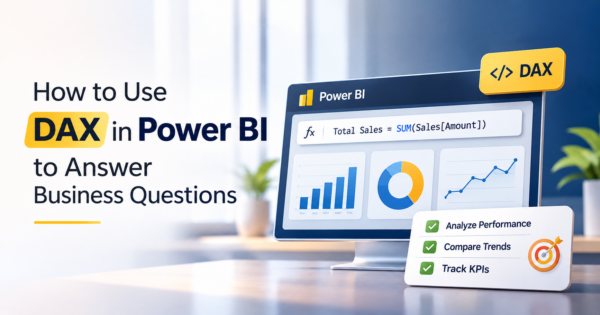
DAX, short for Data Analysis Expressions, is the formula language used in Power BI, Analysis Services and Power Pivot to build calculations on a data model. In Power BI you mostly use it to write measures, which are formulas that recalculate for whatever the report is showing, such as total sales for the selected region and month. DAX looks like Excel formulas, but it works on whole columns and tables and depends heavily on filter context, which is the set of filters the report applies to each number.
TL;DR
- DAX is the formula language behind Power BI calculations. Most business questions are answered with a handful of patterns: sums and ratios, CALCULATE with a filter, time comparisons and percent of total.
- Use a measure for anything you aggregate, such as sales, margin or customer counts. Use a calculated column only when you need a value stored on every row, such as a category label. Microsoft describes measures as formulas whose results change with context.
- The one concept to learn well is filter context. A measure is evaluated separately for every cell in a visual, with the slicers, rows and columns of that cell acting as filters, and CALCULATE is how you change those filters on purpose.
- Time comparisons such as year to date and same period last year need a proper date table marked as the date table in the model. Microsoft says to mark one before using any time intelligence function.
- The article walks through ten formulas that answer common business questions, with a small worked example that computes year-over-year growth month by month.
- The sales figures in the worked example are invented for illustration. Test every formula on your own model, because column and table names differ.
- CommercePundit builds Power BI dashboards and data models. See the last section.
What is DAX, and where do you write it?
DAX is a formula language that works on tables and columns inside a data model, not on cells in a grid. If you know Excel, the syntax will feel familiar, with functions, parentheses and operators, but the thinking is different. A DAX function refers to a whole column or table, and you add filters when you want only some of the rows. You write DAX in Power BI Desktop in the formula bar when you create a measure, a calculated column or a calculated table, and in tools such as DAX Studio or Tabular Editor when you want to query or manage a model.
Microsoft describes three common places DAX lives. Measures are dynamic calculations whose results change depending on context, used in reports where people combine and filter data by many attributes. Calculated columns add a column to a table with a value computed for each row when the data is loaded and stored in the model. Calculated tables build a whole new table from a formula, which helps with role-playing dimensions such as order date and ship date. DAX is also used to write row-level security rules.
When should you use a measure instead of a calculated column?
Use a measure whenever the answer should change as the report changes: total sales, margin percentage, number of customers, average order value. A measure does not store anything. It runs on demand for each cell, with the slicers and visuals acting as filters. Use a calculated column when you need a fixed value on each row that you will slice or filter by, such as a price band, a flag for large orders or a concatenated label. The common beginner mistake is building a calculated column for something like profit and then summing it, which uses memory and gets the wrong answer for ratios. Compute the pieces as measures, then divide.
-- Calculated column on the Sales table: one value per row, stored in the model
Price Band = IF ( Sales[Unit Price] >= 100, "Premium", "Standard" )

-- Measure: calculated on demand for whatever the report is showing
Total Sales = SUM ( Sales[Amount] )
How does filter context change the answer?
Filter context is the idea that makes DAX click. When you put the Total Sales measure in a card, it shows the grand total. Put it in a table with a row for each product category, and the same formula returns a different number in each row, because the category on that row filters the data before the sum runs. Add a slicer for the year and every cell is filtered again. Microsoft explains it as a separate evaluation for each cell: the engine looks at row and column headers, slicers and report filters, builds the filters for that cell and then runs the formula.
You rarely write the filters yourself. The report builds them. What you write is the exception: when you want a number that ignores a filter, adds a filter or moves to another period, you use CALCULATE. It evaluates an expression in a modified filter context, and nearly every useful business measure beyond a plain sum uses it.
Which ten formulas answer most business questions?
Most DAX Power BI tutorials teach functions one at a time, so these ten formulas follow the order in which business questions usually arrive. The examples below assume a common model: a Sales table with Amount, Cost, OrderID, CustomerID and Date columns, a Product table with a Category column and a Date table marked as the date table and related to Sales. Adjust the names to match yours.
1. Totals and margins: how much did we sell, and what did we keep?
Start with a few base measures and build everything else on them, because a measure can be reused inside other measures. For ratios, use DIVIDE and not the slash operator. DIVIDE returns a blank when the denominator is zero instead of an error, which keeps visuals clean.
Total Sales = SUM ( Sales[Amount] )
Total Cost = SUM ( Sales[Cost] )
Gross Margin = [Total Sales] - [Total Cost]
Gross Margin % = DIVIDE ( [Gross Margin], [Total Sales] )
2. Counting: how many customers and orders?
Customers = DISTINCTCOUNT ( Sales[CustomerID] )
Orders = DISTINCTCOUNT ( Sales[OrderID] )
Average Order Value = DIVIDE ( [Total Sales], [Orders] )
3. Filtered totals: how much came from large orders?
CALCULATE takes an expression and one or more filters. Here it recalculates total sales as if only lines over a threshold existed, regardless of what else the report has filtered on that column.
Large Order Sales = CALCULATE ( [Total Sales], Sales[Amount] > 1000 )
Large Order Share = DIVIDE ( [Large Order Sales], [Total Sales] )
4. Year to date: how are we doing this year so far?
Sales YTD = TOTALYTD ( [Total Sales], 'Date'[Date] )5. Same period last year and growth: are we ahead of last year?
SAMEPERIODLASTYEAR shifts the dates in the current context back one year, and CALCULATE applies that shift to the measure. Growth is then a ratio of the difference to last year, again using DIVIDE.
Sales LY = CALCULATE ( [Total Sales], SAMEPERIODLASTYEAR ( 'Date'[Date] ) )
YoY Growth % = DIVIDE ( [Total Sales] - [Sales LY], [Sales LY] )
6. Percent of total: how much does each category contribute?
To compare a row to the total of everything visible, you remove the row filter for the denominator. ALLSELECTED keeps the slicers the user chose but removes the filter coming from the current row, so the percentages add up to 100% of what is on the page.
Share of Sales % =
DIVIDE (
    [Total Sales],
    CALCULATE ( [Total Sales], ALLSELECTED ( Product[Category] ) )
)
7. Running total: how is the year building up?
Running Sales =
CALCULATE (
    [Total Sales],
    FILTER ( ALL ( 'Date'[Date] ), 'Date'[Date] <= MAX ( 'Date'[Date] ) )
)
8. Variables: keep long formulas readable
VAR stores a result under a name and RETURN says what to output. Variables make a formula easier to read and avoid repeating the same calculation. Microsoft’s own overview uses this pattern, noting that a variable can hold any scalar value, including a table.
Growth Label =
VAR Current = [Total Sales]
VAR Prior = [Sales LY]
VAR Growth = DIVIDE ( Current - Prior, Prior )
RETURN
    IF ( ISBLANK ( Growth ), "n/a", FORMAT ( Growth, "0.0%" ) )
9. Iterators: calculate row by row, then add up
Functions ending in X, such as SUMX, evaluate an expression for every row of a table and then aggregate the result. Use them when the calculation needs more than one column on the same row, such as quantity times a price that lives in another column.
Revenue = SUMX ( Sales, Sales[Quantity] * Sales[Unit Price] )10. Ranking: which products are in the top five?
Product Rank = RANKX ( ALL ( Product[Name] ), [Total Sales] )
Top 5 Sales = IF ( [Product Rank] <= 5, [Total Sales] )
What do these measures return? A small worked example
To see the pattern, take invented monthly sales for the first half of two years. The year-over-year measure compares each month to the same month a year earlier, and the year-to-date measure adds up January to the current month.
| Month | 2026 sales | 2025 sales | YoY Growth % |
|---|---|---|---|
| Jan | $132k | $120k | +10.0% |
| Feb | $140k | $135k | +3.7% |
| Mar | $150k | $128k | +17.2% |
| Apr | $149k | $150k | -0.7% |
| May | $176k | $160k | +10.0% |
| Jun | $190k | $170k | +11.8% |
June 2026 shows $190k against $170k a year earlier, which the measure reports as +11.8%. April is the only month where sales fell, by 0.7% from $150k to $149k. Year to date through June is $937k against $863k, or +8.6%. The same two measures drive a card, a line chart with a line for each year and a table by product category, because each cell gets its own filter context. That reuse is the reason to define measures once, with clear names, and build the report from them. Our guides to Power BI dashboard examples and sales dashboard examples show where measures like these end up.
How should you set up the date table?
Time intelligence functions need a proper calendar. Create a date table with one row for every day, covering every year in your data with no gaps, relate it to the date column in your fact table and mark it as the date table in the model. Microsoft says to do that before using any time-intelligence function. Using the date column of the Sales table directly often seems to work and then breaks as soon as a year has a missing day. A separate date table also gives you columns for year, quarter, month name and month number, which you need for sorting and slicing.
Where do DAX formulas go wrong?
The usual problems are the ones that follow from context. A measure that works in a card shows the wrong number in a table because a relationship is missing or points the wrong way. A percent of total that does not add to 100% uses ALL where ALLSELECTED was needed. A running total that resets or stops at the wrong place has a date table that is not marked or a visual that uses the wrong date column. A division that shows errors uses the slash operator instead of DIVIDE.
Performance is the other trap. Row-by-row iterators over very large tables, filters on whole tables instead of single columns and calculated columns that could have been measures all slow a report down. Build measures in layers, test them in a simple table first and look at the model with DAX Studio when something is slow. AI assistants can draft a first version of a formula quickly, but they get names and context wrong often enough that you should read every formula and test it against a number you can check by hand.
If you are choosing between tools, our comparison of Tableau and Power BI shows where DAX sits against Tableau calculations. For the data going into the model, see our guides to ETL tools and data migration tools, and for executive and financial views see financial dashboard examples and KPI dashboard examples.
Frequently Asked Questions
What is DAX in Power BI?
DAX stands for Data Analysis Expressions. It is the formula language used in Power BI, Analysis Services and Power Pivot to create measures, calculated columns, calculated tables and row-level security rules on a data model.
What is the difference between a measure and a calculated column?
A measure is a formula that is calculated on demand for the current context of the report, so its result changes with slicers and visuals. A calculated column computes a value for each row when the data is loaded and stores it in the model.
What does CALCULATE do in DAX?
CALCULATE evaluates an expression in a modified filter context. You use it to add, replace or remove filters, for example to total sales for large orders only or to compare with the same period last year.
What is filter context in DAX?
It is the set of filters that apply to a calculation, coming from slicers, report filters, rows and columns in a visual and filters written in the formula. A measure is evaluated separately in the filter context of each cell.
Do I need a date table for time intelligence in Power BI?
Yes. Microsoft says to mark one of your tables with a date column as the date table before using time intelligence functions. It should have one row per day with no gaps and be related to your fact table.
How do I calculate year over year growth in DAX?
Create a measure for the same period last year with CALCULATE and SAMEPERIODLASTYEAR, then divide the difference between this year and last year by last year using DIVIDE.
Why should I use DIVIDE instead of the division operator?
DIVIDE handles a zero or blank denominator by returning a blank, or an alternate value you choose, instead of an error, which keeps visuals clean.
What is the difference between ALL and ALLSELECTED?
ALL removes filters from the columns or table you name, including slicers. ALLSELECTED removes the filters coming from the current row or column of the visual but keeps the filters chosen by slicers and report filters.
Is DAX hard to learn?
The syntax is easy if you know Excel. The challenge is understanding filter context. Start with simple measures, test them in a table and add CALCULATE and time intelligence once you can predict what a simple measure will show.
Can AI write DAX for me?
It can draft a starting point, but AI often gets table names, relationships and context wrong. Read every formula, test it in a simple table and check results against a number you can verify by hand.
Bottom Line
DAX is a small language with a few patterns that carry most business reporting: base measures, safe division, CALCULATE with a filter, time comparisons and percent of total. Learn filter context, build a proper date table and write measures in layers you can test. If you want a Power BI model and dashboards built around your own data, see our business intelligence and dashboard services and AI and data integration services.