Table of Content

What are DevOps tools?
DevOps tools are the software a team uses to plan, build, test, release, run and monitor an application as one connected process. They fall into stages: planning, source control, CI/CD, infrastructure as code, containers and orchestration, observability, security and incident response. You do not need a tool for every stage on day one; you need the smallest set that lets you ship safely.
TL;DR
- Organize DevOps tools by pipeline stage, not by brand. Most teams need one tool per stage, and several stages can be served by the same platform.
- The right stack depends on team size more than on features. A five-person team should lean on hosted services; a platform team of dozens can justify self-hosting some tools.
- Every tool has a running cost in admin time. In our worked example, a small-team stack takes under ten hours a month to look after, while a large self-managed stack takes about 60 hours.
- Measure the result, not the toolchain. The four DORA metrics (deployment frequency, lead time for changes, change failure rate and time to restore service) tell you if the tools are helping.
- AI assistants help with pipeline config, log reading and runbooks, but they do not replace tests, reviews or approvals.
- Tool names in this guide are examples, not rankings, and the hours in the worked example are assumptions built for this guide.
- CommercePundit sets up CI/CD, containers and cloud operations. See the last section.
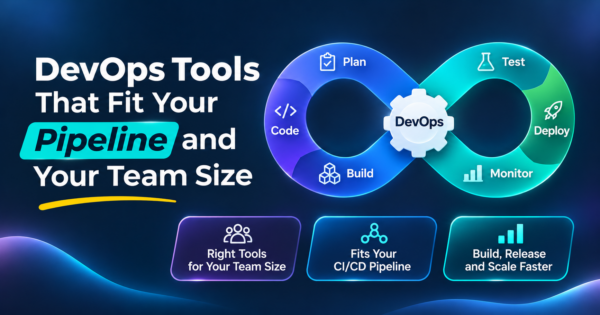
What does a DevOps pipeline look like?
Each stage feeds the next, and what you learn while observing goes back into planning.
Which DevOps tools belong at each stage?
| Stage | What the tool does | Common examples (not a ranking) | Start with |
|---|---|---|---|
| Plan and track | Backlog, tickets, roadmaps | Jira, Linear, GitHub Issues | The issue tracker built into your code host |
| Source control and review | Hosts code, enforces pull request review | GitHub, GitLab, Bitbucket | One code host for everything |
| CI/CD | Builds, tests and deploys on every change | GitHub Actions, GitLab CI/CD, Jenkins, CircleCI | The pipeline feature of your code host |
| Containers and registry | Packages the app and stores images | Docker, Amazon ECR, GitHub Packages | Docker plus your cloud provider’s registry |
| Infrastructure as code | Defines servers, networks and services in files | Terraform or OpenTofu, Pulumi, AWS CloudFormation, Ansible | One tool that fits your cloud |
| Orchestration and deployment | Runs containers at scale and rolls out releases | Kubernetes, Helm, Argo CD, Flux | A managed container service until you outgrow it |
| Testing in the pipeline | Automated checks on each build | Playwright, Selenium, JUnit, pytest | Unit and smoke tests first |
| Security scanning | Finds vulnerable dependencies, secrets and misconfigurations | Dependabot, Snyk, Trivy, SonarQube | Dependency scanning in CI |
| Observability | Metrics, logs, traces and dashboards | Prometheus, Grafana, Datadog, OpenTelemetry, Sentry | Error tracking plus basic metrics |
| Incident response | Alerts, on-call schedules, runbooks | PagerDuty and similar paging tools | A single on-call rotation with clear escalation |
Two notes on the table. First, tools overlap: GitHub and GitLab each cover source control, issue tracking and CI/CD, which is why many small teams run on one platform. Second, containers and Kubernetes are not the same decision. Our comparison of Kubernetes vs Docker explains when you need an orchestrator at all.
What does a toolchain cost to look after?
Licenses are only part of the cost. Every tool needs upgrades, access reviews, broken-build fixes and someone who understands it. The example assumes 1.5 admin hours per month for a hosted tool and 6 for a self-managed one, and an engineer cost of $90 per hour. Those inputs are assumptions, so replace them with your own.
| Team | Tools | Of which self-managed | Admin hours per month | Share of one engineer-month (160 hours) | Admin cost per month |
|---|---|---|---|---|---|
| Small team (about 5 engineers) | 6 | 0 | 9 | 6% | $810 |
| Mid-size team (about 25 engineers) | 10 | 3 | 28 | 18% | $2,565 |
| Large team (about 100 engineers) | 12 | 9 | 58 | 37% | $5,265 |
The small team spends about 9 hours a month on its tools, so it can run them part-time. The large team spends about 58 hours, which is why large organizations staff a platform team. The lesson for a small company is simple: every self-hosted tool you add needs an owner, so pick hosted versions until a specific need says otherwise. Jenkins is a good example. It is flexible and widely used, but you host, secure and upgrade it yourself.
Which stack fits your team size?
| Team size | Recommended shape | Skip for now |
|---|---|---|
| Up to 10 engineers | One code host with built-in CI/CD, Docker, one infrastructure-as-code tool, a managed hosting service, error tracking and basic cloud monitoring | Self-managed Kubernetes, a separate secrets platform, custom dashboards |
| 10 to 50 engineers | Add managed Kubernetes if you run many services, GitOps deployment (Argo CD or Flux), Prometheus and Grafana or a hosted equivalent, a paging tool and security scanning | Running your own CI servers unless a requirement forces it |
| 50 or more engineers | A platform team that offers paved roads: standard pipelines, a service catalog, policy as code, central observability and cost controls | One-off tools chosen by each team; they multiply admin hours |
If your product still runs on a single server, you can get far without Kubernetes. Teams that already use containers can see how we help in our Docker development services and Kubernetes deployment services.
How do you choose between competing tools?
| Question | Why it matters |
|---|---|
| Does it work with the code host and cloud you already use? | Native integration saves weeks of glue code |
| Is there a managed version? | Saves admin hours, as the cost table showed |
| How hard is it to leave? | Pipelines written in a proprietary format lock you in; keep build logic in scripts the team owns |
| Who will own it? | A tool without an owner decays within a quarter |
| Can you try it on one real service first? | A two-week trial on a real service beats a feature chart |
| What does it need in secrets and permissions? | CI systems hold the keys to production; limit them |
For a broader look at automation platforms beyond engineering, see our guide to AI workflow automation tools.
How do you know the toolchain is working?
| DORA metric | What it measures | What a bad number often means |
|---|---|---|
| Deployment frequency | How often you release to production | Releases are big and scary; batch size is too large |
| Lead time for changes | Time from commit to running in production | Slow reviews, slow tests or manual approvals |
| Change failure rate | Share of releases that cause a failure needing a fix | Weak tests or no staging checks |
| Time to restore service | How fast you recover from a failure | No rollback plan or poor alerting |
These four measures come from the DevOps Research and Assessment program, now part of Google Cloud. Pull them from your pipeline data each month. If a new tool does not move one of them, question why you run it. Automated checks in the pipeline are covered in our automation testing services.
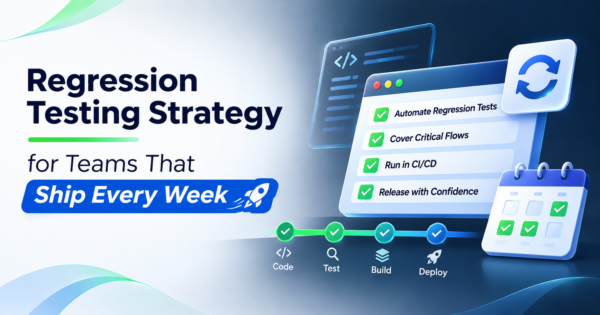
What should a CI/CD pipeline run, and in what order?
Order the checks so the cheapest and fastest run first and fail fast. The time targets are suggestions for a healthy pipeline, not benchmarks.
| Order | Pipeline step | Purpose | Suggested time target |
|---|---|---|---|
| 1 | Lint and format check | Catch style and syntax errors | Under 1 minute |
| 2 | Unit tests | Verify logic in isolation | Under 5 minutes |
| 3 | Dependency and secret scan | Block known vulnerable packages and leaked keys | Under 3 minutes |
| 4 | Build the container image | Create the artifact once and reuse it everywhere | Under 5 minutes |
| 5 | Image scan | Check the image for known vulnerabilities | Under 3 minutes |
| 6 | Integration and API tests | Verify services work together | Under 10 minutes |
| 7 | Deploy to staging and smoke test | Prove the release works in a production-like place | Under 10 minutes |
| 8 | Approval (if required) | Human gate for regulated or high-risk releases | Depends on policy |
| 9 | Deploy to production with rollback ready | Release using a rolling or canary strategy | Under 15 minutes |
Build the artifact once and promote the same image through staging and production. Rebuilding at each stage is how a release that passed staging behaves differently in production.
How do you roll out a toolchain in 30 days?
| Week | Do this | Done when |
|---|---|---|
| 1 | Pick one service and move it to a single code host with required reviews and a basic CI pipeline | Every change runs lint and unit tests automatically |
| 2 | Containerize the service and add an image scan and a staging deploy | A merged change lands in staging without manual steps |
| 3 | Define the infrastructure for staging in code and add error tracking and basic alerts | You can rebuild staging from the repository |
| 4 | Add a one-command rollback, a production deploy step and the four DORA metrics | You can release and roll back in minutes, and you know your baseline |
Where does AI fit in DevOps?
- Pipeline and config drafts. Assistants can draft CI workflows, Dockerfiles and Terraform from a description. Review every change as you would a colleague’s pull request, and never give an assistant production credentials.
- Log and incident summaries. Summaries of error logs and alerts speed up the first ten minutes of an incident.
- Runbooks and documentation. Drafts of runbooks save time if an engineer verifies each step against the real system.
- What it does not do. It does not replace tests, approvals or the on-call engineer who knows the system.
Teams setting up delivery for a new product can see our MVP development guide for how early products approach it, and our guide to AWS cloud migration for the infrastructure side.
What mistakes do teams make with DevOps tools?
| Mistake | What happens | Fix |
|---|---|---|
| Adopting Kubernetes first | A small team spends its time on the platform, not the product | Start with a managed service; move when scale demands it |
| One tool per team preference | Five pipelines and nobody can fix them all | Standardize on a few paved paths |
| Pipelines nobody owns | Builds break and stay broken | Assign an owner and an SLA for pipeline health |
| Secrets in CI variables without limits | A compromised pipeline exposes production | Use short-lived credentials and scope them |
| No staging or rollback | Failures reach customers | Add a staging deploy and a one-command rollback |
| Measuring tools instead of outcomes | Dashboards look busy, delivery stays slow | Track the DORA metrics |
If you want a partner to run infrastructure while your team ships features, see our AWS cloud managed services and IT infrastructure management services.
Frequently Asked Questions
What are DevOps tools?
DevOps tools are the software used to plan, build, test, release, operate and monitor applications as one process. They are grouped by stage, such as source control, CI/CD, infrastructure as code, containers, observability and incident response.
What are the most common DevOps tools?
Common choices include GitHub or GitLab for code, GitHub Actions, GitLab CI/CD or Jenkins for pipelines, Docker for containers, Terraform for infrastructure as code, Kubernetes for orchestration, Prometheus and Grafana for monitoring, and PagerDuty for on-call alerts.
Which DevOps tools should a small team start with?
Use one code host with built-in CI/CD, Docker, one infrastructure-as-code tool, a managed hosting service and error tracking. Hosted versions keep admin time low, and you can add more as specific needs appear.
Do I need Kubernetes to do DevOps?
No. Many teams run well on managed application hosting or a simple container service. Kubernetes helps when you run many services at scale and have people to operate it. See our comparison of Kubernetes and Docker for details.
Is Jenkins still worth using?
It is flexible and widely used, and many organizations still run it. The trade-off is that you host, secure and upgrade it yourself, so teams without a platform group often prefer the CI built into their code host.
What is the difference between CI and CD?
Continuous integration builds and tests every change automatically. Continuous delivery or deployment takes a tested change and releases it to an environment, either with a manual approval or automatically.
How do I measure if my DevOps tools are working?
Track the four DORA metrics: deployment frequency, lead time for changes, change failure rate and time to restore service. Improvement in these shows the toolchain is helping delivery.
Which AI tool is best for DevOps engineers?
There is no single best one. AI assistants help draft pipeline files, summarize logs and write runbooks. Keep humans on review and approvals, and never share production credentials with an assistant.
How much do DevOps tools cost?
License prices vary by vendor and plan, so check current pricing. The larger and less visible cost is admin time, which grows with every self-managed tool. Estimate both before you commit.
Bottom Line
Choose DevOps tools by pipeline stage and team size, favor hosted services until a real need says otherwise, give every tool an owner and judge the stack by the DORA metrics. If you want CI/CD, containers and cloud operations set up without hiring a platform team, talk to us about our Kubernetes deployment services and the other infrastructure work above.